Mastering Flutter Inspector DevTools for Effective Debugging
Background
As a Flutter developer, You’ve come across those frustrating UI-related issues that make your app display a bothersome yellow and black striped line on the screen. In fact, two of the most frequently encountered errors are directly related to Widget Overflow and Vertical viewport was given unbounded height. but, With Flutter Inspector, we can solve these errors and optimize Flutter app performance.
In this article, we’ll explore how to use Flutter Inspector to debug and optimize performance, including a step-by-step demonstration on a sample screen.
Sponsored
Positive thinking leads to positive outcomes. Try out Justly, build good habits, and start thinking positively today!
Introduction
The Flutter Inspector DevTools allows you to explore the widget tree visually and provides a graphical interface that allows you to dive deep into the structure and behavior of the Flutter app. The Flutter Inspector can assist in debugging layout-related issues. By utilizing the inspector’s visual widget tree, we can inspect the properties of individual widgets and identify misconfiguration in widget properties.
Before we dive into our debugging adventure, let’s first familiarize ourselves with that Flutter Inspector and the valuable tools it provides.
To debug a layout issue, run the app in debug mode and open the inspector by clicking the Flutter Inspector tab on the DevTools toolbar.
What is Flutter Inspector?
Let’s explore the key components of Flutter Inspector.
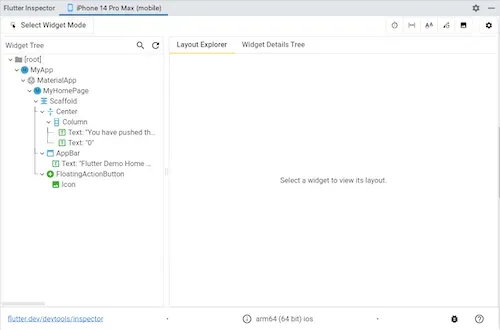
Widget Tree
The Widget Tree provides a visual representation of the widget hierarchy of the app’s UI. The widget tree allows you to navigate through the different widgets, inspect their properties, and identify their relationship.
Layout Explorer
The Layout Explorer in Flutter Inspector focuses on analyzing both flex layout and fixed-size layout
For Flex layouts, such as Row, Column, and Flex, the Layout Explorer visualizes the layout of flex widgets and their children. It identifies the main and cross axes, alignment, flex, and layout constraints. It also highlights overflow errors, helping developers understand and resolve these issues.
By clicking on a widget in the Layout Explorer, you can mirror the selection on the on-device inspector, allowing for inspection and modification of widget properties. You can make changes to properties like flex factor, flex fit, and alignment directly in the Explorer, with real-time updates reflected on the device. These modifications are temporary and do not affect the source code.
For Fixed-size layouts, the Layout Explorer provides size, constraint, and padding information for selected widgets. This data gives you information on how these widgets are positioned and spaced within the layout.
Widget Detail Pane
The Widget Detail Pane displays the properties and values of the selected widget in the widget tree. It provides detailed information about the widget, including types, constraints, padding, margins, and more.
Toolbar
The following tools are available in the Flutter inspector’s toolbar,
Select widget mode
By enabling this mode, you can select widgets on the device and inspect their properties. This allows you to dive deep into the specific details of the widget and understand its behavior within the UI.
Refresh Tree
Use this option to reload and update the widget information in the Inspector. If you’ve made changes to your app’s UI and want the Inspector to reflect those changes, simply click on the Refresh button. It ensures that you’re working with the most up-to-date widget tree information.
Slow Animations
This feature slows down animations 5 times. It’s particularly useful when you want to ensure smooth and visually appealing animations in your app. By enabling Slow Animations, you can observe the animation frame by frame and make any necessary adjustments to achieve the desired visual effect.
Show Guidelines Mode
Enabling this mode overlays guidelines on the screen to assist you in fixing layout issues. These guidelines act as visual references, helping you align and position widgets accurately within your UI.
Show Baselines
This option displays baselines, which are essential for aligning text correctly. Selecting this option will make all the baselines visible, allowing you to check the alignment of the text precisely.
Highlight Repaints
Enabling this feature shows borders around elements that repaint when their state changes. It helps identify unnecessary repaints and optimize your app’s rendering performance.
Highlight Oversized Images
This tool highlights images that consume excessive memory by inverting their colors. It allows you to easily identify and optimize image resources, ensuring efficient memory usage in your app. By optimizing image sizes or using compressed formats, you can reduce memory usage and enhance app performance.
Great features, isn’t it?…
Let’s dive into how we can use these tools to implement our Demo screen and fix any layout issues that come our way.
Debugging With the Flutter Inspector
Let’s incorporate the case study into this article. We’ll build the below screen using Flutter Inspector for debugging purposes.

This is our main.dart file,
void main() {
  runApp(const MaterialApp(home: MyApp()));
}

class MyApp extends StatelessWidget {
  const MyApp({super.key});
  @override
  Widget build(BuildContext context) {
    return Scaffold(
      appBar: AppBar(
        title: const Text('Buy Medicine'),
        centerTitle: true,
      ),
      body: Padding(
        padding: const EdgeInsets.all(15),
        child: Column(
          children: [
            // Sections of the screen will be placed here
          ],
        ),
      ),
    );
  }
}
We can start by implementing the three sections of our screen: The Header with User information, the Main Section with ListView, and the Footer with a button.
Header
Let’s add a Header that displays User information. We’ll create UserInformation Widget for that. Here’s the code,
class UserInformation extends StatelessWidget {
  const UserInformation({Key? key}) : super(key: key);

  @override
  Widget build(BuildContext context) {
    return  Row(
      children: [
        Column(
          crossAxisAlignment: CrossAxisAlignment.start,
          children: const [
            Text('Hi Ninja, 👋🏻  ',
                style: TextStyle(
                    fontSize: 20, fontWeight: FontWeight.bold)),
            SizedBox(height: 10,),
            Text(
              'Relieve Your Cough with our top Recommended Medicines',style: TextStyle(fontSize: 17),)
          ],
        ),
        const CircleAvatar(
            minRadius: 30,
            backgroundImage: NetworkImage(
                'https://img.freepik.com/premium-vector/woman-profile-cartoon_18591-58477.jpg')),
      ],
    );
  }
}
When you run the app, you’ll see an overflow error.

Don’t panic! Let’s follow the debugging steps to identify and fix the issue.
1. In Terminal, You’ll see errors like this
======== Exception caught by rendering library =====================================================
The following assertion was thrown during layout:
A RenderFlex overflowed by 128 pixels on the right.

The relevant error-causing widget was:
  Row Row ...
The overflowing RenderFlex has an orientation of Axis.horizontal.
The edge of the RenderFlex that is overflowing has been marked in the rendering with a yellow and black striped pattern. This is usually caused by the contents being too big for the RenderFlex.

Consider applying a flex factor (e.g. using an Expanded widget) to force the children of the RenderFlex to fit within the available space instead of being sized to their natural size.
This is considered an error condition because it indicates that there is content that cannot be seen. If the content is legitimately bigger than the available space, consider clipping it with a ClipRect widget before putting it in the flex, or using a scrollable container rather than a Flex, like a ListView.

◢◤◢◤◢◤◢◤◢◤◢◤◢◤◢◤◢◤◢◤◢◤◢◤◢◤◢◤◢◤◢◤◢◤◢◤◢◤◢◤◢◤◢◤◢◤◢◤◢◤◢◤◢◤◢◤◢◤◢◤◢◤◢◤◢◤◢◤◢◤◢◤◢◤◢◤◢◤◢◤◢◤◢◤◢◤◢◤◢◤◢◤◢◤◢◤◢◤◢◤
2. Navigate to DevTools and open the Layout Explorer tab
Click on Errors and you’ll see that a Red banner appears at the bottom indicating that something is wrong. Let’s take a closer look at it, We observe that the width of a Text widget is 468, while the parent’s width is 400. Additionally, the children’s width sum up to 528, resulting in a RenderFlex overflowed by 120 pixels on the Right.
Let’s set the flex factor of the Column widget to 1, it’s like wrapping the widget in Expanded widget, as the default value of flex is 1.

Great 👍. The issue is fixed…or is it?.
Unfortunately, when you run the app again, the issue comes back. Why?
As we saw earlier, These modifications are temporary and don’t affect the source code. So, let’s wrap the Column widget in the Expanded widget to ensure that it takes only the necessary space within the raw.
class UserInformation extends StatelessWidget {
  const UserInformation({Key? key}) : super(key: key);

  @override
  Widget build(BuildContext context) {
    return  Row(
      children: [
        Expanded(
          child: Column(
     ....
        ),
     ....
}
And there you have it!!
Now, let’s move on to the Main section of our screen.
Main Section
class MedicineList extends StatelessWidget {
  const MedicineList({Key? key}) : super(key: key);

  @override
  Widget build(BuildContext context) {
    return  ListView(
      children: [
        ListTile(...),
        ListTile(...),
        ListTile(...),
      ],
    );
  }
We have the MedicineList widget which is a Simple ListView containing ListTile widgets to display basic information about medicines.
Let’s add MedicineList Widget to our MyApp class in our main.dart file
class MyApp extends StatelessWidget {
....
  @override
  Widget build(BuildContext context) {
    ....
        child: Column(
          children:const  [
            UserInformation(),
            MedicineList()
          ],
        ),
}
Now, if you run the app, you may encounter an issue where nothing is displayed on the screen and you’ll see the following error.
======== Exception caught by rendering library =====================================================
The following assertion was thrown during performResize():
Vertical viewport was given unbounded height.

Viewports expand in the scrolling direction to fill their container. In this case, a vertical viewport was given an unlimited amount of vertical space in which to expand. This situation typically happens when a scrollable widget is nested inside another scrollable widget.

If this widget is always nested in a scrollable widget there is no need to use a viewport because there will always be enough vertical space for the children. In this case, consider using a Column or Wrap instead. Otherwise, consider using a CustomScrollView to concatenate arbitrary slivers into a single scrollable.

The relevant error-causing widget was:
  ListView ListView ....
Fixing Unbounded Height Error
Open up the Flutter inspector and click on the MedicineList widget.
Nothing appears in the Layout Explorer after clicking on the MedicineList. That’s because Layout Explorer only supports Flex widgets and their direct children.
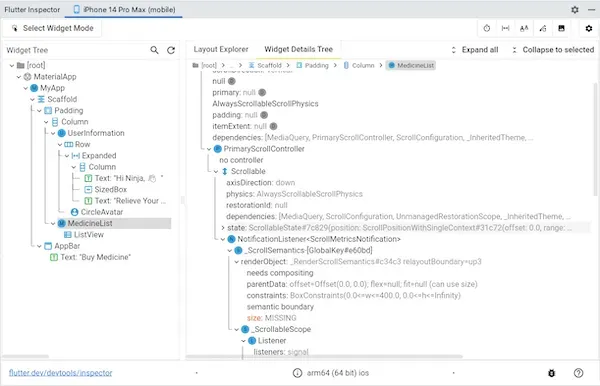
So, let’s move on to the next step and open the Widget Details Tree and expand renderObject in Listview.
You’ll notice that the Size parameter is missing and highlighted in Orange color. Additionally, the constraints are shown as BoxConstraints(0.0≤w≤400,0.0≤h≤infinity), indicating that height is infinite in its scrolling direction.
So, 🤔 what’s happening here?
Constraints go down. Sizes go up, and Parent sets position.
In Flutter, Each widget gets its own constraints from its parent and asks each child what size it wants to be and the child widget tells its parent about size. However, in our case, as the parent, the Column widget did not provide any height and ListView is taking infinite height. As a result, the widgets don’t know how to handle the situations.
To resolve this, Let’s wrap Listview in the Expanded widget as it gives bounded constraints along the parent’s main axis, which will provide the ListView with a proper height.
class MedicineList extends StatelessWidget {
  @override
  Widget build(BuildContext context) {
    return  Expanded(
       child: ListView(
        ...
      ),
    );
  }
}
Now, hot reload the app and see the result,

Footer
class CartButton extends StatelessWidget {
  const CartButton({Key? key}) : super(key: key);

  @override
  Widget build(BuildContext context) {
    return SizedBox(
      height: 50,
      width: 200,
      child: ElevatedButton(
        onPressed: () {},
        child: Row(
          children: const [
            Icon(Icons.shopping_cart),
            SizedBox(
              width: 20,
            ),
            Text(
              'Add To Cart',
              style: TextStyle(fontSize: 20),
            )
          ],
        ),
      ),
    );
  }
}
Let’s add CartButton to MyApp class in main.dart file.
class MyApp extends StatelessWidget {
 @override
  Widget build(BuildContext context) {
    ....
        child: Column(
          children:const  [
            UserInformation(),
            MedicineList(),
            CartButton()
          ],
        ),
      ),
    );
  }
}
So, now let’s run the app, you’ll see the below output.

We are done, right? Hold on, we are missing that horizontal line between UserInformation and ListView So, let’s add Divider.
Column(
  children:const  [
    UserInformation(),
    Divider(),
    MedicineList(),
    CartButton()
  ],
),
Hot reload. complete!! 😃
But wait, a question might pop up in your mind: what’s the purpose of tools in the toolbar of Flutter Inspector? As we used a NetworkImage in our implementation, let’s enable the Highlight Image tool and see what happens.
Fixing Highlight Image
Open Flutter Inspector and enable the Highlight Image option and you got the following output.

But, What’s that? Check the error message in the console.
======== Exception caught by painting library ======================================================
The following message was thrown while painting an image:
Image https://img.freepik.com/premium-vector/woman-profile-cartoon_18591-58477.jpg has a display size of 210×210 but a decode size of 626×626, which uses an additional 1811KB.
Consider resizing the asset ahead of time, supplying a cacheWidth parameter of 210, a cacheHeight parameter of 210, or using a ResizeImage.
We got this for Image in Header as we have used NetworkImage whose actual decoded size is 625*625 pixels and we provided a display size of 210*210 pixels. This means that Image is being loaded at a higher resolution than necessary, leading to increased memory usage.
Let’s use ResizeImage widget for memory optimization.
class UserInformation extends StatelessWidget {
  @override
  Widget build(BuildContext context) {
    ....
         CircleAvatar(
            minRadius: 30,
            backgroundImage:ResizeImage(
              NetworkImage(),
              width: 210,
              height: 210
            ),
         )
      ],
    );
  }
}
Here, we specify the desired display size of 210*210 pixels. By doing so, we’re telling Flutter to load the image at the right resolution, preventing unnecessary Memory consumption.
Now, let’s run the app once more.
No more error messages, just a smooth and Optimized UI 👍.
Conclusion
In this article, we have explored the power of the Flutter Inspector in debugging Flutter apps and resolving UI-related issues.
By utilizing the Widget tree, Layout explorer, and widget detail pane, we can visually navigate through the widget hierarchy, inspect properties and identify any misconfiguration or layout-related issues. The flutter inspector’s Performance optimization features, such as highlighting repaints and oversized images, help identify and resolve rendering and memory usage problems, ensuring a smooth and efficient app experience.
We’re Grateful to have you with us on this journey!
Suggestions and feedback are more than welcome!
Please reach us at Canopas Twitter handle @canopas_eng with your content or feedback. Your input enriches our content and fuels our motivation to create more valuable and informative articles for you.
Happy debugging! 👋
Useful Articles


Get started today
Let's build the next
big thing!
Let's improve your business's digital strategy and implement robust mobile apps to achieve your business objectives. Schedule Your Free Consultation Now.
Get Free Consultation
Get started today
Let's build the next big thing!
Let's improve your business's digital strategy and implement robust mobile apps to achieve your business objectives. Schedule Your Free Consultation Now.
Get Free Consultation